Do you want to know the secret of every successful Amazon Seller? It’s not an expensive inventory management system or a golden supplier. In fact, it’s something you can look at in less than 10 seconds.
Successful sellers (big or small!) understand how to read
Amazon’s Best Sellers Rank (BSR).
I’m going to show you what I’ve learned about decoding BSR this week.
Where to find Amazon's Best Sellers Rank?
The “best selling” product within a category has a BSR of #1 in that category. The second “best selling” product in a category has a BSR of #2 in that category (and so on). Amazon’s algorithm calculates BSR by comparing the number of times a specific product is ordered to how many times all other products are ordered in the same category.
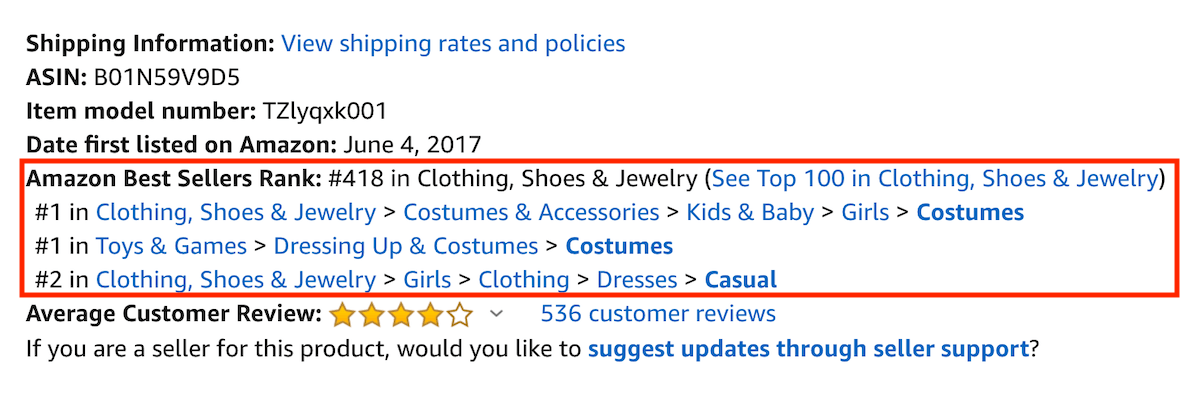
A product’s BSR can be found on the seller central app or the products detail page. As you can see below, products are typically listed in multiple categories and subcategories. Amazon bases these on how customers search for the item. There is typically a top tier category. In this case it is #418 in Clothing, Shoes & Jewelry. The sub-category for this product is the #1 best seller in the sub-category “costumes”. There are more than 60,000 sub-categories on Amazon.

Product's best sellers rank
Don't Check One Number, Look into Longterm Trends
I have a fellow Amazon-selling friend named Nic. He’s been selling for a few years so he’s a font of knowledge when it comes to selling on Amazon.
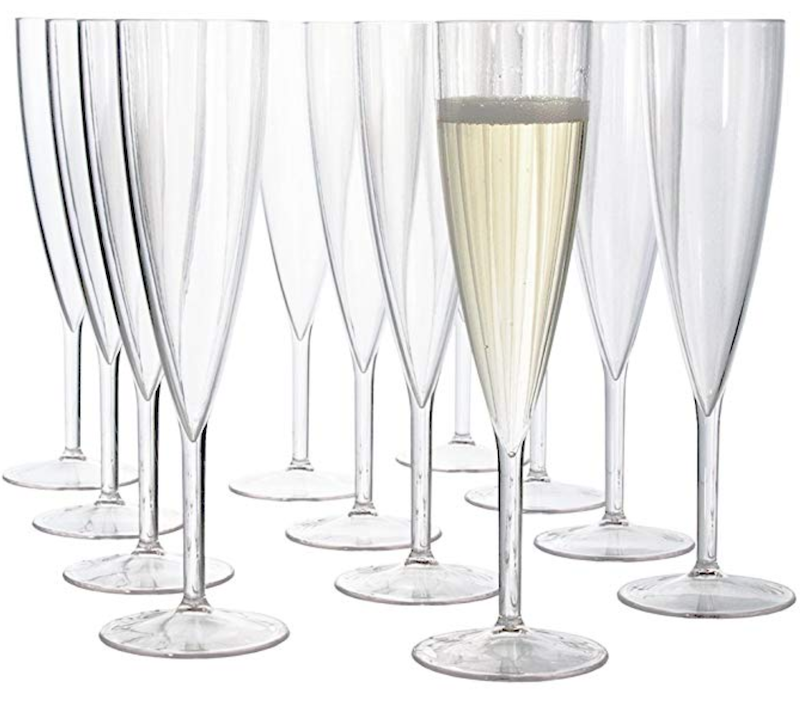
At the end of last year, when I was just starting to research Amazon selling, Nic sent me examples of a few products he had purchased from a household wholesale account he had landed that week. One of the products he was especially excited about was a set of plastic champagne glasses. They had a great sales rank, solid profit margins and were lightweight and cheap to ship.

Watch out for inflated sales rank on seasonal products like champagne flutes
He told me he put in an order for 500 units. They sold like hotcakes for 2 weeks.
Then the inconceivable happened.
His sales came to a screeching halt. Instead of 80 units a week, he started selling 1-2.
He was mystified. This had been a golden item for him. Why had sales plummeted so badly?
That is, until his wife mentioned a New Years party they had missed.
It dawned on him. The sales rank he had originally looked at was inflated because of the holiday, And he still had 338 units that were going to have to sit at the warehouse for a year. All because he didn’t consider a holiday.
Even experienced sellers like Nic make errors when calculating sales rank. There is no single, golden formula to break down down exactly how Amazon calculates a product’s seller’s rank, but you can use some basic math to make good estimates.
Before I purchase a wholesale product, I make sure to understand how a product is ranked in its category to understand the sales volume I can expect. Dead and slow-moving items clog cash flow and incur storage and removal fees which is exactly the opposite of what I’m trying to do. After all -- I only have six months to build this business.
First off, I look at how an item is classified. All of Amazon’s products fall into one of the following 33 categories. Some of these are gated -- meaning I can’t sell in them, but we’ll go over that in a few weeks.
How to Project Sales Numbers?
A certain amount of products are available within each category -- for example, there are just under 500,000 video games listed for sale on Amazon as of today. Some categories are much bigger, for example there are over 6 million toys and almost 87 million home and kitchen products!
Amazon sales rank tells me where a product lines up within it’s category. As I’m typing this, the card game UNO is #4 in Toys and Games. It sells the 4th most in its respective category. This rank is displayed in the Seller Central app, as well as the bottom of each Amazon listing. This rank is in constant flux -- it moves every time a sale is made (though it doesn’t update in real time).
Two products with the same rank, but in different categories, have a completely different volume.
A musical instrument with a rank of 7500 may sell one unit a day, while a kitchen product with a rank of 7500 will sell at least 50 units a day. The musical instrument was in the top 10% percent of its category, while the kitchen product was in the top 1%.
Here’s how I calculate projected sales volume: Very roughly, an item in the top 1 percent of a category will sell at least 10 units a day. An item in the top 10% of a category will sell at least 1 units a day. Keep in mind, that this has to be split between the number of sellers. So, if you’re looking at an item that sells 100 units a day and there are 10 sellers at the same price, you would sell roughly 10 items a day.
You can calculate this easily using the following sales rank chart:
| Category | Total Products | Top 1% | Top 5% | Top 10% |
|---|---|---|---|---|
| Arts, Crafts & Sewing | 3,961,395 | 39,614 | 198,070 | 396,140 |
| Automotive | 12,453,235 | 124,532 | 622,662 | 1,245,324 |
| Baby | 1,641,740 | 16,417 | 82,087 | 164,174 |
| Beauty and Personal Care | 5,531,915 | 55,319 | 276,596 | 553,192 |
| Books | 47,294,403 | 472,944 | 2,364,720 | 4,729,440 |
| Cell Phones and Accessories | 7,688,997 | 76,890 | 384,450 | 768,900 |
| Clothing, Shoes & Jewelry | 86,339,264 | 863,393 | 4,316,963 | 8,633,926 |
| Computers and Accessories | 3,455,983 | 863,393 | 4,316,963 | 8,633,926 |
| DVD and Blu-ray | 9,779,335 | 97,793 | 977,934 | 4,889,668 |
| Electronics | 8,192,191 | 81,922 | 409,610 | 819,219 |
| Grocery & Gourmet Food | 1,861,971 | 18,620 | 93,099 | 186,197 |
| Handmade | 929,394 | 9,294 | 92,939 | 464,697 |
| Heath & Household | 4,189,913 | 41,899 | 209,496 | 418,991 |
| Home & Kitchen | 28,842,812 | 288,428 | 1,442,141 | 2,884,281 |
| Industrial & Scientific | 6,500,371 | 65,004 | 325,019 | 650,037 |
| Luggage & Travel Gear | 394,787 | 3,948 | 39,479 | 197,394 |
| Office Products | 4,689,252 | 46,893 | 234,463 | 468,925 |
| Patio, Lawn & Garden | 3,821,358 | 38,214 | 191,068 | 382,136 |
| PC & Video Games | 258,436 | 2,584 | 25,844 | 129,218 |
| Pet Supplies | 2,461,032 | 24,610 | 123,052 | 246,103 |
| Software | 183,767 | 1,838 | 9,188 | 18,377 |
| Sports and Outdoors | 17,468,747 | 174,687 | 873,437 | 1,746,875 |
| Tools & Home Improvement | 10,190,876 | 101,909 | 509,544 | 1,019,088 |
| Toys | 5,351,373 | 53,514 | 267,569 | 535,137 |
This isn’t an exact science -- some items will sell much more than my formula, but I try to calculate it based on the minimal amount.
Some seasonal items can have drastic rank changes. For example, a package of chocolate santas with a rank of 1000 in December will probably have a 300,000 rank in January. Also, smaller categories (such as Arts and Crafts) will generally have less volume overall. This is why It’s important to always keep tabs on how a sales rank moves.
ALWAYS double check category and ranking using the actual Amazon website (not just the app) before you make a purchase.
As always, thanks for following my journey. Tune in next week as I learn about wholesale vs private label. Keep earnin’ and burnin’.
Please also read how to Improve Your Product Ranking in Amazon.
-- Allee
